Apdex
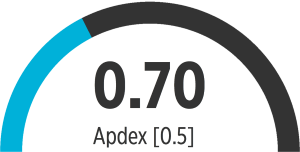
Apdex (Application Performance Index) allows us to monitor end-user satisfaction. It is an open industry standard that estimates the end user’s satisfaction level on an application’s response time through a score between 0 and 1.
The Apdex score is calculated based on your required SLA (Service-Level Agreement) where you can define a response time threshold of T seconds, where all responses handled in T or less seconds satisfy the end user.
Apdex provides three thresholds estimating end user satisfaction, satisfied, tolerating and frustrating.
- Satisfied: Response time less than or equal to T seconds.
- Tolerating: Response time between T seconds and 4T seconds.
- Frustrating: Response time greater than 4 T seconds.
App Metrics caculates the counts of the three thresholds using a Histogram to sample data recorded. The value T seconds, histogram sample size and reservoir sampling type can be configured when creating the ApdexOptions.
The Apdex score between 0 and 1 is calculated using the following: ( Satisfied requests + ( Tolerating requests / 2 ) ) ) / Total number of requests
Using Apdex
var apdex = new ApdexOptions
{
    Name = "Sample Apdex",
    ApdexTSeconds = 0.5 // Adjust based on your SLA
};

using (_metrics.Measure.Apdex.Track(apdex))
{
    // Method to track apdex score for
}
The App.Metrics.AspNetCore.Tracking nuget package by default provides an apdex score on all requests.
Here is the result of running a sample and viewing in Grafana
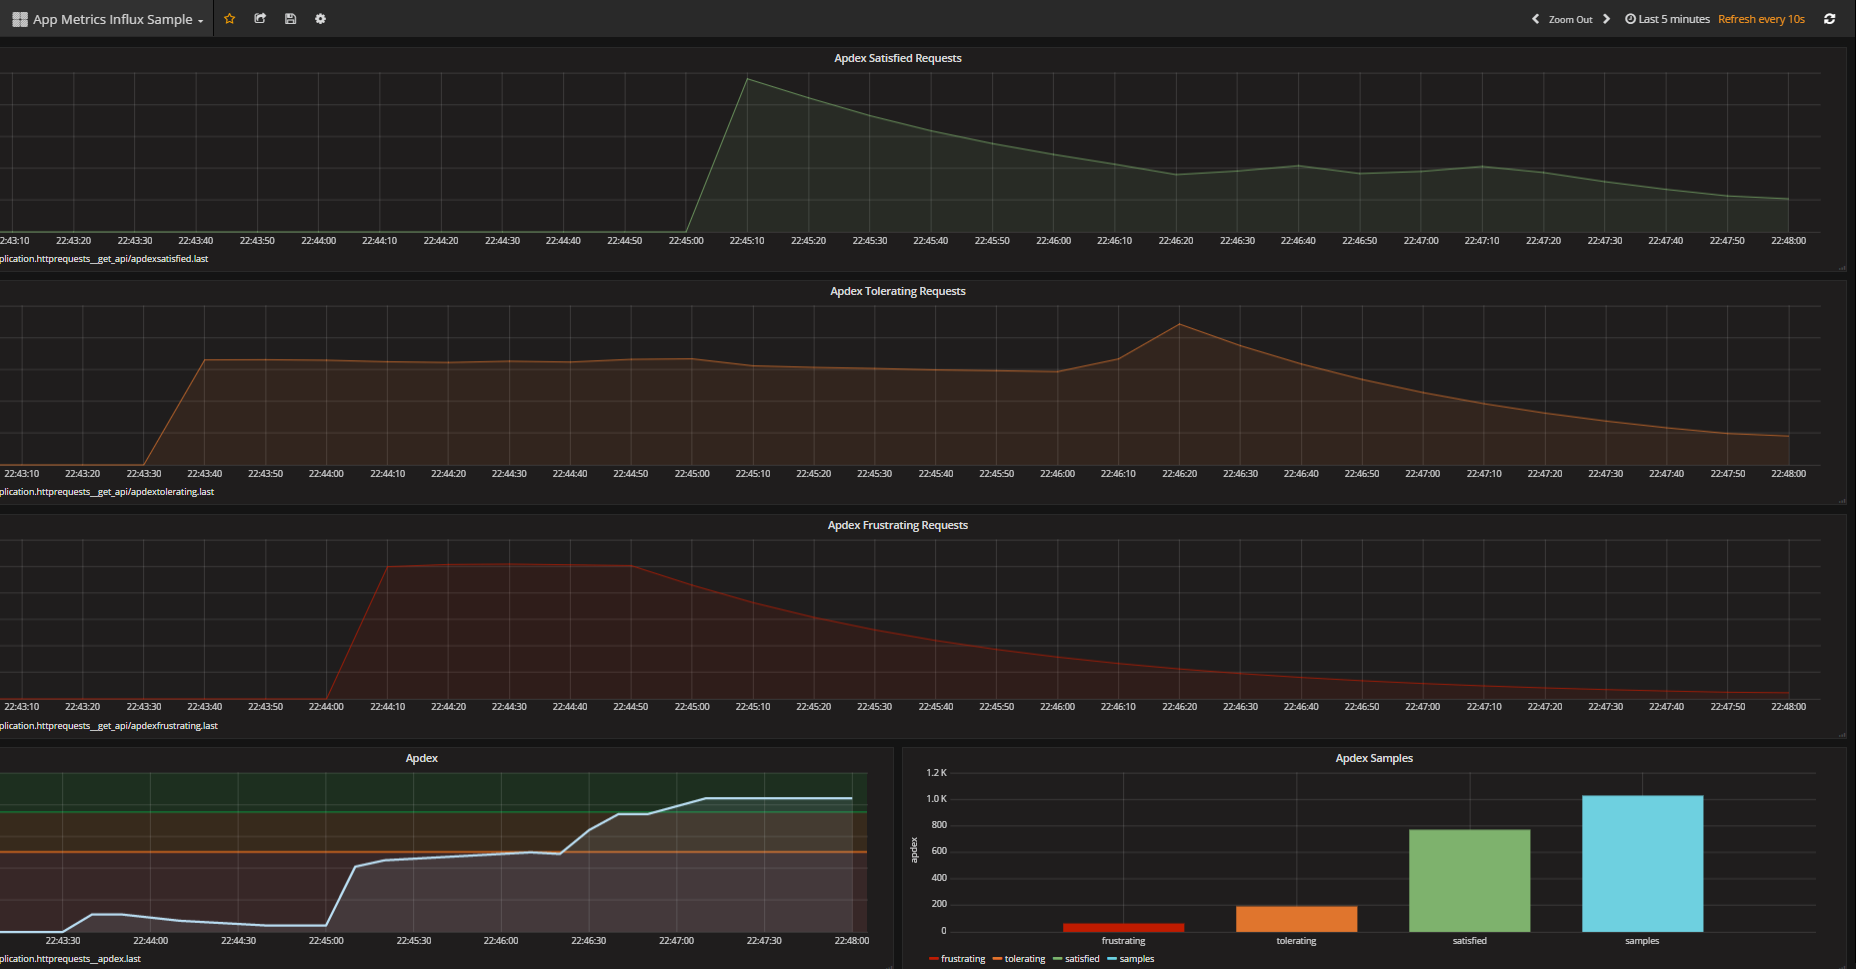
We can see in the image above that at the time when there were many frustrating requests the apdex as in the critial threshold at the bottom left of the dashboards, as these requests dropped of and the number of satisfied requests increased the apdex score began to increase towards one.